


Starting from Kimi K3: technology premiums, capital and compute spending, and who actually keeps the economic rent
I. What Kimi K3 Actually Proves
On July 16, 2026, Moonshot AI’s Kimi K3 took first place on Arena.ai’s front-end coding leaderboard with a score of 1,679, ahead of Claude Fable 5’s 1,631 and GPT-5.6 Sol’s 1,618. Its predecessor, Kimi K2.6, had ranked 18th on the same leaderboard — a jump of seventeen places in a single model generation. Yet on Artificial Analysis’s composite intelligence index, K3 ranks fourth with 57.1 points, trailing Claude Fable 5 (59.9) and GPT-5.6 Sol (58.9). “Winning one category” and “closing the gap across the board” are two different things.
This starting point needs a footnote of its own: as of this writing, Arena still labels K3’s top position “Preliminary” — the model has accumulated only about 1,757 valid votes, versus 2,505 for Claude Fable 5 and 2,542 for GPT-5.6 Sol, so both the score and the ranking could still shift as more votes come in. Building this entire piece on a leaderboard position that hasn’t yet stabilized is itself a reason to stay disciplined about every conclusion that follows.
A seventeen-place jump in one generation doesn’t prove that catching up is inherently cheap, but it does show that, under the current technical paradigm, a leader’s capability edge has not hardened into an unbridgeable generational moat. From that, it’s reasonable to infer that the capability gap among the frontier labs is narrowing noticeably — a pattern the past year’s steady progress from DeepSeek, Qwen, GLM, and Kimi has already confirmed, not an isolated case. But jumping straight from there to “there’s no moat at the model layer,” and then to “the trillion-dollar valuation narrative doesn’t hold,” skips three steps: whether the moat has actually disappeared, merely changed shape, or simply changed hands; and, whichever it is, whether the remaining rent can actually reach the model companies’ free cash flow after subtracting ongoing investment.
II. The Core Argument
Are frontier model companies the kind of business that can be priced using the standard growth-stock playbook? The answer right now is probably no — they are certainly growing, but the shape of that growth doesn’t look like the software growth stocks we’re used to. Growth-stock valuations assume more than rising industry demand; they assume a company’s competitive advantage can compound indefinitely. But a frontier model’s relative technical edge is turning into a rapidly depreciating asset that’s hard to bank on its own as durable economic rent. So a trillion-dollar valuation has to clear two tests. First: what does a brief window of technical leadership ultimately turn into? This piece breaks that into three possible paths. Second: can whatever survives be converted into free cash flow after subtracting ongoing capital and compute spending? This piece breaks that into four observable metrics.
III. Why a Model’s Edge Depreciates So Fast
Traditional software advantages used to last five to ten years. The frontier models’ technology-premium window is shrinking from years to something measured in months — an observational estimate based on recent release cadences and leaderboard movement, not a precise measurement. That’s a function of the competition’s underlying structure: technical approaches across labs have converged heavily, public benchmarks openly tell challengers what to optimize for, user interaction data is becoming raw material for distillation, and engineering know-how from training and post-training spreads extremely fast.
More important is a cost structure that gets overlooked. Closed-model companies have to keep funding capital and compute on both the training and inference sides — whether that shows up as self-built infrastructure, cloud purchases, or long-term compute commitments. Open-weight model companies, by contrast, can shift a good share of inference cost onto cloud vendors, enterprise customers, and third-party service providers. Pioneers pay for every mistake they make along the way; challengers only need to confirm that a given approach works, then reproduce similar results with cleaner data and smarter post-training — at a fraction of the original cost.
This time, though, there’s a counter-signal hiding in the price sheet. K3’s API pricing — $3 per million input tokens, $15 per million output tokens — is identical to Anthropic’s Sonnet 5. This is the first time a Chinese frontier model has priced itself right off a leading U.S. model’s rate card. A challenger no longer cashing in its late-mover advantage through a price war suggests it believes its capability is already worth that price. But flip it around, and it also shows that “technology premium” is becoming an asset that can be copied and matched almost as fast as it appears — the premium is still there, it’s just no longer any one company’s alone.
Call it the technology-premium half-life — how many months after a new model ships before its lead decays to half its original size. The shorter that half-life, the harder it is to price this layer of economic rent as a standalone asset. To be clear, what decays is the “premium,” not the model’s entire value. A company getting overtaken on some leaderboard in a given month doesn’t mean the model suddenly becomes useless — most users never even notice. What actually disappears fast is the part of the premium that says “clearly better than everyone else, and can justifiably charge more for it.” The model’s basic day-to-day usefulness erodes far more slowly.
IV. The Moat Hasn’t Vanished — It May Just Have Changed Shape: Three Paths
Even a short technology-premium window doesn’t mean “the moat is gone.” A more accurate way to put it: a brief lead in technology is just raw material. What it ultimately turns into can follow one of three paths.
Path 1: Structural lock-in. Turn a temporary capability edge into a lasting workflow dependency — subscriptions, API integrations, internal enterprise processes, agent ecosystems. This is the classic platform playbook: win the window, weld the customer in place, and even after a specific capability gets matched, switching costs alone keep the revenue. Both OpenAI’s push into the application ecosystem and Anthropic’s push into enterprise agents and coding tool chains are bets on this path.
Path 2: Sustained execution speed. Don’t count on any single lock-in lasting forever; instead, stay near the frontier through a high release cadence — Anthropic’s current near-biweekly pace is the clearest example — and re-earn the premium in every new window. Here the moat isn’t a static asset but the organization’s iteration speed itself, which never gives rivals a window wide enough to catch up. The cost is just as clear: the spending can never stop, and the moment the release cadence slips, the premium goes to zero. This is a moat built on a treadmill.
Path 3: Rent leaks out. The model company creates the value but doesn’t get to keep the largest share of it. Model capability sits with labs like OpenAI, Anthropic, and Moonshot, but the compute comes from cloud vendors like Microsoft, Amazon, and Google; chip scarcity sits with Nvidia; and consumer access and enterprise workflows are controlled by platforms like ChatGPT, Apple, Microsoft 365, AWS, and Salesforce. OpenAI has Microsoft’s compute and distribution behind it; Anthropic has Amazon’s and Google’s cloud infrastructure behind it — but that only answers “can it stay in the game,” not “who ultimately captures the economic rent.” A cloud vendor’s compute, capital, and distribution channel can be a model company’s competitive advantage, but it can just as easily strengthen the cloud platform’s bargaining power over the model company — Microsoft, Amazon, and Google are entirely capable of being the party that takes the largest share of the value a model company creates, not an unconditional ally.
In reality, what shows up is probably not any single path in its pure form but a hybrid: leading companies bet on Paths 1 and 2 simultaneously, while constantly fighting the pull of Path 3. That calls for giving “conversion” a measurable name — call it the technology-rent conversion rate: a model company’s ability to turn a brief model lead into lasting customer relationships and cash flow. It breaks down into four observable metrics: the technology-premium half-life (how many months a lead survives after a new model ships); the lock-in conversion rate (how much of the user base a model’s lead attracts actually settles into subscriptions, API usage, enterprise workflows, or agent ecosystems); unit economics (whether inference gross margin holds up as token prices fall); and capital-and-compute investment efficiency (how much additional training, inference, and infrastructure spending is needed for every extra dollar of revenue). The first two metrics measure whether Paths 1 and 2 are actually working; the last two point to the next question — even if they are working, is this actually a good business?
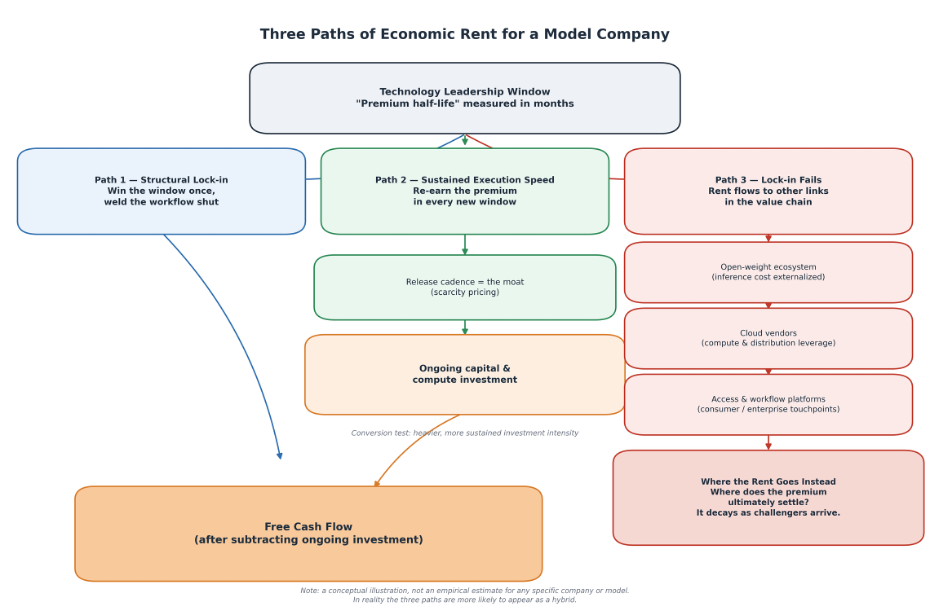
Figure: The three paths of a model company’s economic rent — whichever path it takes, revenue has to clear ongoing investment first
Note: This figure is a conceptual illustration, not an empirical estimate for any specific company or model; the orange shading corresponds to the “free cash flow after ongoing investment” step discussed below; in reality, the three paths are more likely to appear as a hybrid.
V. Two Faces of Capital Intensity: Liability, or Ticket to Play
Here we have to deal with a counterargument. This piece has been treating ongoing training and compute spending as a drag on valuation, but the same fact can be read the opposite way: precisely because staying at the frontier requires tens of billions of dollars a year, the number of seats at the table is structurally limited — capital intensity itself might be the moat. The semiconductor industry’s precedent is TSMC: massive capex isn’t the enemy of the moat, it is the moat. But that logic only holds on one condition — that the spending converts into a cumulative learning curve in yield and process technology, so that each generation raises, rather than lowers, the cost of catching up.
The trouble for the model industry is that there’s more evidence against this condition than for it right now. Kimi K3 is the latest counterexample: 2.8 trillion parameters, weights slated to open-source on July 27, with the company claiming 2.5 times the intelligence-per-unit-of-compute efficiency of its predecessor — a vendor claim, still awaiting independent verification once the weights are public. If the open-weight camp can keep pace with the frontier at lower capital intensity, the “spending equals the ticket to play” logic weakens: the ticket price isn’t rising each generation — it’s being discounted by challengers’ engineering efficiency. Which theory holds — capital moat or rapid depreciation — depends on the relative slope of the frontier’s training-cost curve versus the challengers’ catch-up-cost curve. That’s an empirical question that can be tracked quarter by quarter, not a matter of opinion. This piece’s position: until there’s evidence the slope has reversed, it’s more prudent to book capital intensity as a liability.
VI. The Industry Is Growing — Why the Companies May Not Be the Growth Stocks We Know
The usual logic chain stops at: technology leadership → structural lock-in → economic rent → growth-stock valuation. That chain is basically right, but it’s missing the last — and most easily overlooked — link: capital and compute spending, and whatever free cash flow survives after subtracting it. Two of the four metrics from the previous section already hint at the answer: unit economics and capital-investment efficiency are precisely what measure whether this is a good business. The complete chain needs one more segment: technology leadership → user acquisition → workflow lock-in → revenue growth → gross margin → free cash flow after ongoing capital and compute spending → valuation. What makes the model industry unusual is that its technical edge isn’t a one-time R&D investment that collects rent for years — it has to be continually re-funded to be maintained. So it’s entirely possible for industry demand to grow exponentially, company revenue to grow rapidly, and shareholder returns to be mediocre — all at the same time. If token prices fall faster than inference costs do, or if the investment needed for the next model generation grows faster than revenue, a company could end up looking like “a growth stock on revenue, a capital-heavy business on cash flow” — that, not “will it get caught up to,” is the real test a trillion-dollar valuation has to pass, and a much harder one to answer.
This isn’t a purely theoretical exercise — there are already numbers to plug in. Anthropic’s run-rate revenue (most recent month, annualized) has moved as follows: roughly $9 billion at the end of 2025, $14 billion in February 2026, $19 billion in March, $30 billion in April, and past $47 billion in May, officially disclosed alongside its Series H funding announcement. Third-party data firm Yipit’s estimate — reported via media coverage, not an official company figure — puts July at roughly $69 billion, with the daily increment rising from about $400 million in May to about $550 million. That confirms just how forceful industry demand expansion can be, but it’s also exactly where this framework gets tested: how much of this growth comes from genuine customer lock-in, and how much from customers hedging their bets across multiple models at once. Third-party data shows a substantial share of enterprise customers who pay for OpenAI’s products are also paying for Anthropic — that looks more like “hedging across multiple vendors” than structural lock-in. When the overall market is expanding, several leading companies can each capture incremental growth, which isn’t the same thing as any one of them having welded its customers in place.
More importantly, it’s worth confronting a piece of evidence that cuts against this article’s thesis. According to media reports, Anthropic gave Series H investors second-quarter-2026 revenue guidance of roughly $10.9 billion, and expected to reach quarterly profitability once it hit that number. If true, that shows “a growth stock on revenue, a capital-heavy business on cash flow” isn’t an iron law of the industry — a leading company may be able to approach breakeven while still maintaining a high release cadence. But three things keep this counterexample from closing the question. First, third-party analysis points out that Anthropic recognizes revenue from cloud-resale channels (AWS, Google, and the like) on a gross basis — booking the end customer’s full spend as revenue and the amount paid to the channel as a cost — which inflates reported revenue relative to peers that report on a net basis, making the two not fully comparable. Second, a single profitable quarter isn’t the same thing as cross-cycle free cash flow after subtracting the next model generation’s training spend, and the latter is the real denominator for valuation. Third, at the other end of the same industry, third-party estimates put OpenAI’s first-quarter-2026 loss at roughly $7 billion, with an operating margin of about negative 122%, carrying roughly $25 billion a year in infrastructure costs and about $6 billion in revenue share owed to Microsoft. Amid the very same demand surge, the two leading companies’ cash-flow profiles have already diverged in direction — and that divergence is itself the clearest evidence for this article’s thesis: industry growth doesn’t automatically get split evenly among every company.
Historically, “exponential demand growth alongside mediocre shareholder returns” has played out more than once in capital-intensive, commoditized industries: a century of rising airline traffic has produced meager cumulative shareholder returns; memory-chip demand has been in a long secular bull market that has nonetheless periodically destroyed capital. Counterexamples exist too: TSMC turned capital intensity plus a learning curve into rent, and Amazon deliberately suppressed free cash flow to buy market position, eventually getting the market to price it in anyway. Where model companies land on that spectrum is exactly what the previous section’s four metrics need to answer, quarter by quarter.
It’s also worth clarifying the consumer side: ordinary users don’t switch products over a few leaderboard points, and most never look at leaderboards at all. Technical switching costs really are low for consumers, but behavioral switching costs aren’t necessarily just as low — usage habits, conversation history, subscription relationships, and accumulated personalization data all create real stickiness. Whether that stickiness can support the revenue curve depends on whether it shows up financially as higher renewal rates and lower customer-acquisition cost, not just on the surface-level observation that “users haven’t left yet.”
VII. What a Trillion-Dollar Valuation Is Actually Betting On
Pulling the layers apart, the fact-level judgment that holds up is this: the gap among the leading labs is narrowing, the technology-premium window is shrinking, and a moat built purely on one generation’s model lead is clearly not sturdy enough anymore. But the real question is no longer the binary “will it get caught up to” — it’s how the weight splits across the three paths: of every dollar of technology premium, how much settles into structural lock-in, how much gets re-earned every window through execution speed, and how much leaks out to cloud vendors, the chip layer, and access platforms. Anthropic’s revenue curve shows that at least one company is converting technical leadership into revenue fast — that’s a good sign, but revenue growth on its own isn’t the answer.
Kimi K3 doesn’t prove that OpenAI’s and Anthropic’s trillion-dollar valuations are wrong, but it does shift the burden of proof onto the valuation side: frontier-model leadership alone is no longer enough to support a trillion-dollar price tag. What private markets and strategic investors are pricing in today are two things that haven’t happened yet — a platform transformation (can these companies become the AI era’s user gateway, enterprise workflow, and agent operating system before their technology premium fades?), and an unproven investment-efficiency curve (can revenue growth keep outrunning the capital and compute spending needed to stay at the frontier, and ultimately convert into free cash flow?).
So, back to the title: these companies are certainly growth stocks — demand, revenue, and capability are all compounding at a historically rare pace. But they may not be the kind we’re used to. Familiar growth stocks build a moat once and collect rent on it for years; this species builds its moat on a treadmill, having to win it back every quarter with fresh investment. Until customer renewal rates, inference gross margins, investment efficiency, and market-share compounding answer the question quarter after quarter, a trillion-dollar valuation isn’t an already-realized moat — it’s a massive bet that the treadmill keeps running.
Leaderboards decide who’s ahead for now. Cash flow decides who actually owns the moat.
Data note: Anthropic’s run-rate revenue and Q2 guidance cited in this piece come from the company’s own funding-announcement disclosures; other figures are drawn from media reports including Bloomberg and CNBC. Yipit and Sacra are third-party data-firm estimates. All OpenAI financial figures are third-party estimates and have not been confirmed by the company. Kimi K3 leaderboard data is current as of July 17, 2026; its compute-efficiency figures are vendor-reported claims.